Small business in Western Australia at a glance.

Image
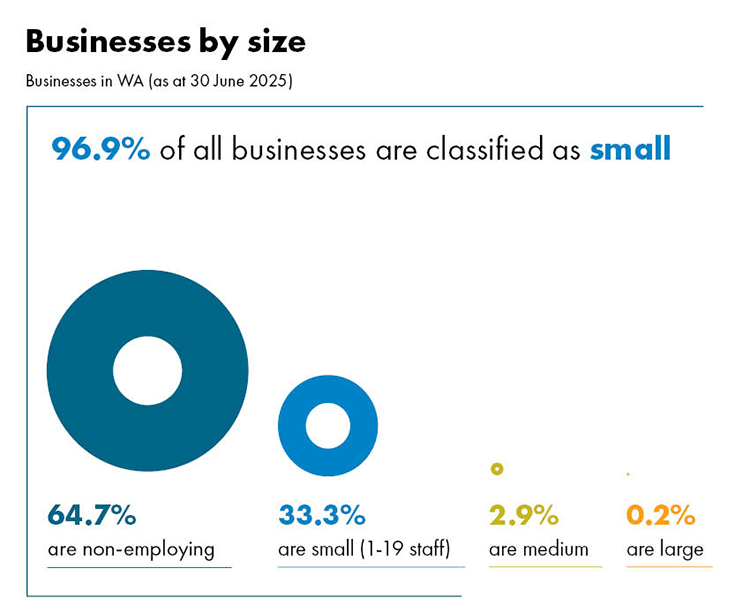
A graph showing businesses by size in Western Australia. The graph explains that 96.9% of all businesses are classified as small (this includes 64.7% are non-employing businesses), 2.9% of businesses are medium size and 0.2% are large.


Image
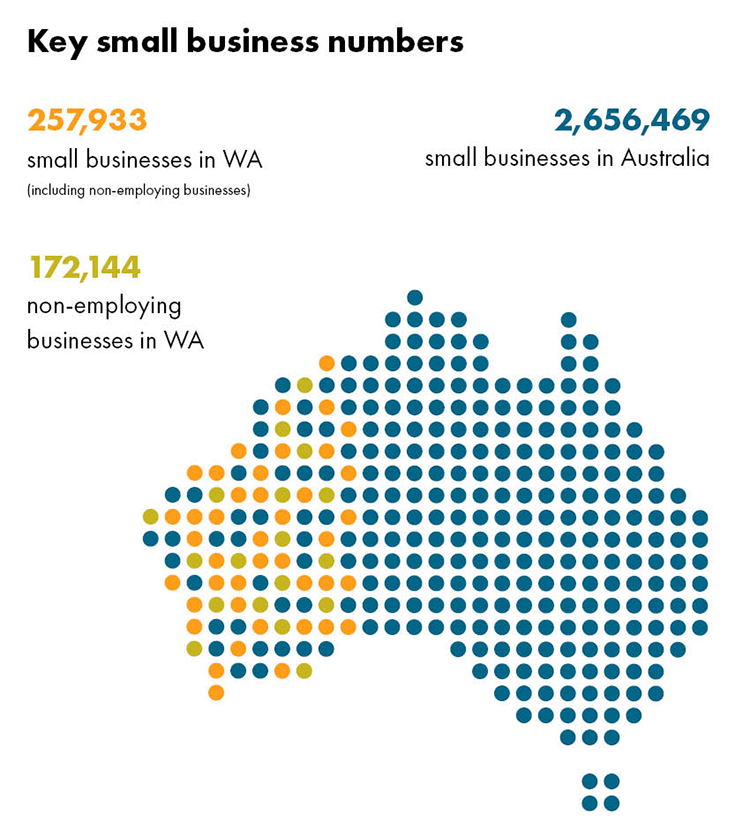
Key small business numbers graph. The graph illustrates that there are 257,933 small businesses in WA (including non-employing businesses), 172,144 non-employing businesses in WA and a total of 2,656,469 small businesses in Australia.


Image
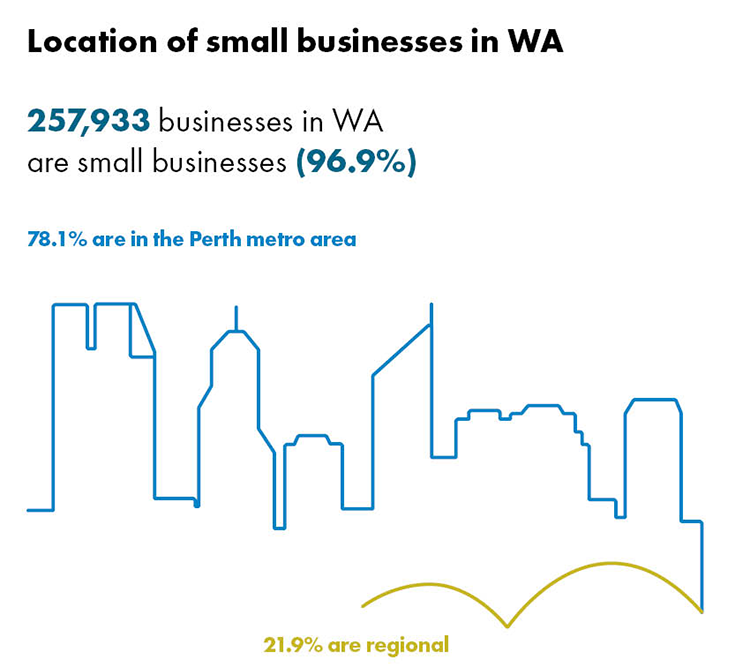
Location of small businesses in WA graph. The graph shows that 78.1% of small businesses in WA are in the Perth metro area and 21.9% are in regional Western Australia.


Image
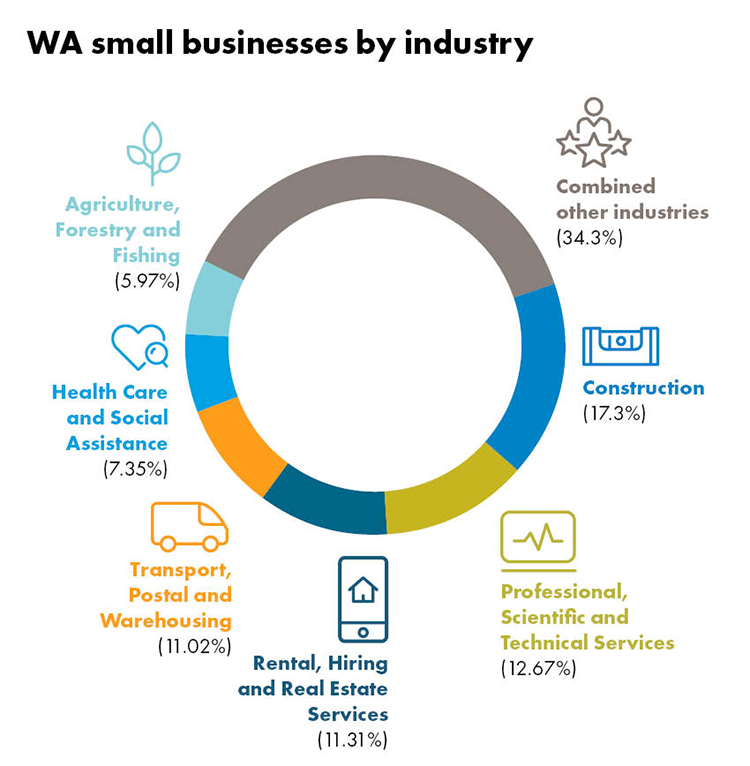
WA small businesses by industry graph. The graph shows that 17.3% of businesses are in construction, 12.67% are in professional, scientific and technical services, 11.31% are in rental, hiring and real estate services, 11.02% are in transport, postal and warehousing, 5.97% are in agriculture, forestry and fishing and 34.3% are combined other industries.


Image
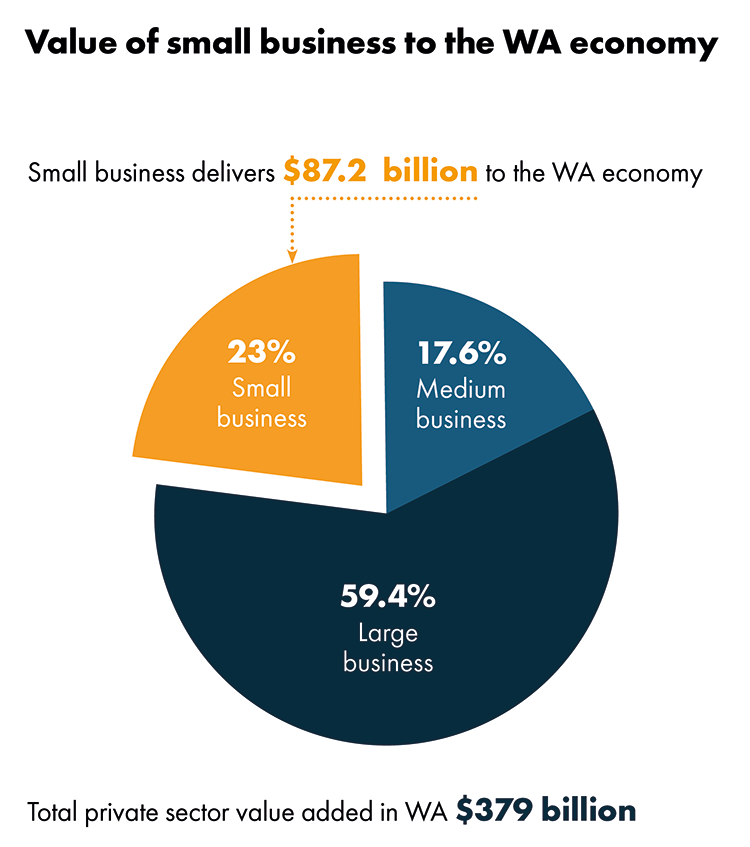
Pie chart showing the contribution of small, medium and large sized businesses to the WA economy. The graphic shows that small businesses contribute 87.2 billion (23%).


Image
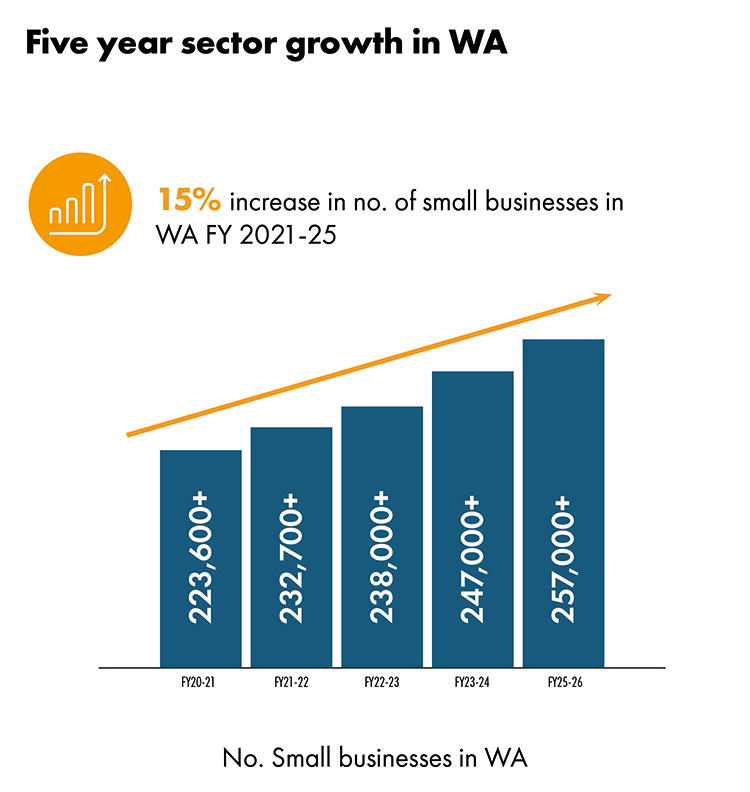
Bar chart showing the increasing number of small businesses in Western Australia between the 2021 and 2025 financial years.


Image
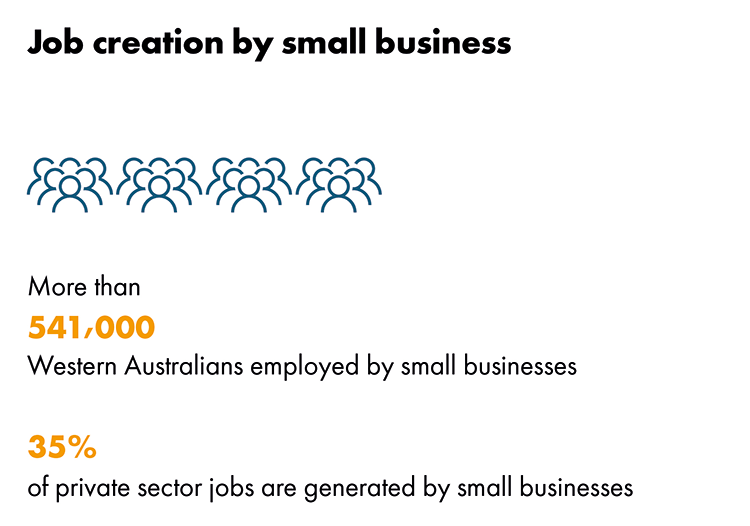
Infographic showing that more than 541,000 Western Australians are employed by small businesses and 35% or private sector jobs are generated by small businesses.


Notes on statistics

  • Statistics as of 30 June 2025.
  • Source: Australian Bureau of Statistics - Counts of Australian Businesses, including Entries and Exits.
  • In relation to the statistics, the SBDC uses the standard Australian Bureau of Statistics (ABS) definition of small business, which is any non-employing business or a business employing fewer than 20 people. However, for legal purposes, the definition of a small business is as stated in the Small Business Development Corporation Act 1983.
  • As with any analysis based on data sets it is subject to a degree of error. Individual numbers or percentages should not be used as absolutes.
  • Statistics include only those businesses actively remitting Goods and Services Tax (GST). As such, small businesses not registered for GST are not captured in this data.
  • Five year sector growth, job creation and value of small business to the WA economy information derived from Western Australian Treasury Corporation economic analysis for SBDC using Australian Bureau of Statistics dataset 8165.0 Counts of Australian Businesses, including Entries and Exits, June 2021 - June 2025.